Know when something breaks. Before your customers do.
Onagre checks your websites, APIs, scheduled jobs, databases and queues as often as every minute, from our public agents or from inside your network. When a check fails, it opens an incident and alerts the right people where they already work.
Free plan, no credit cardHosted in FrancePublic and private agents
app.onagre.io
14sensor types, server metrics included
9alert channels, from email to webhooks
1minbetween two checks on paid plans
10sensors on the free plan, with no time limit
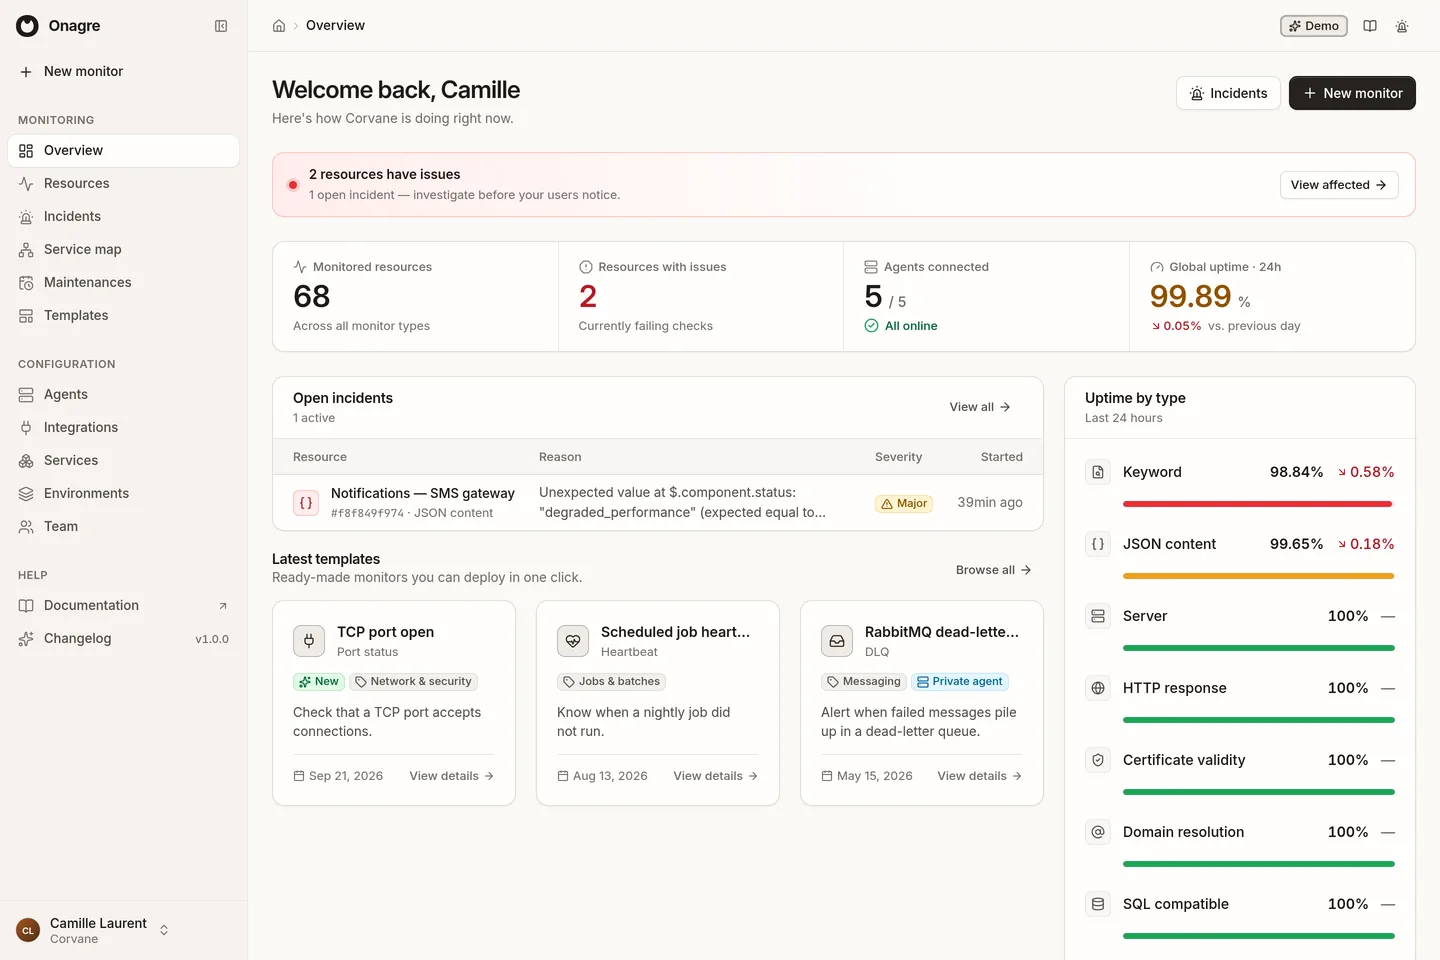
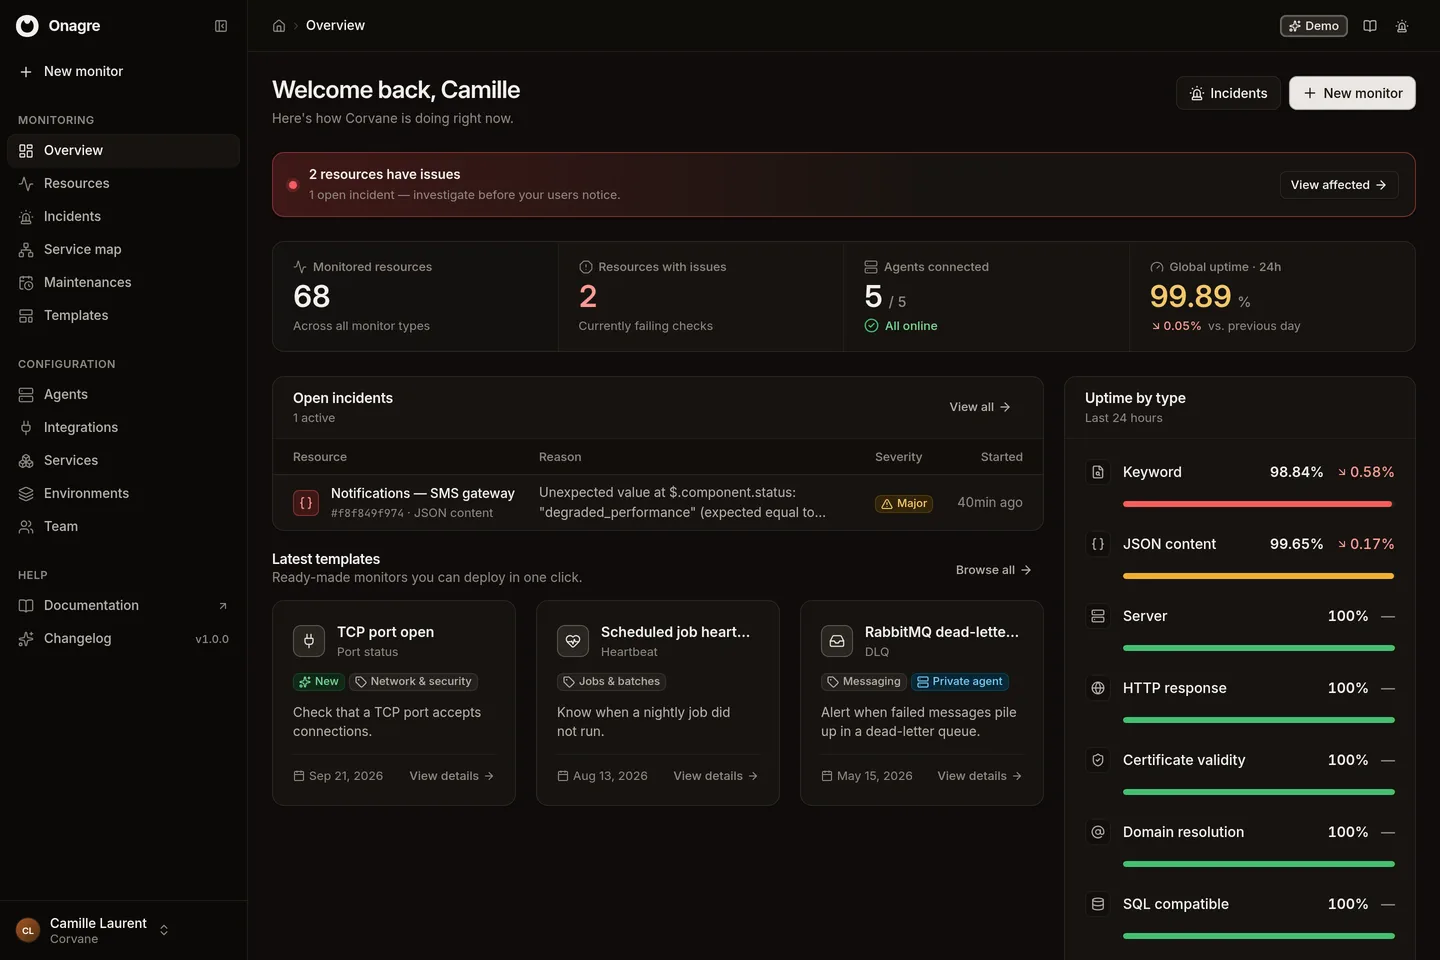
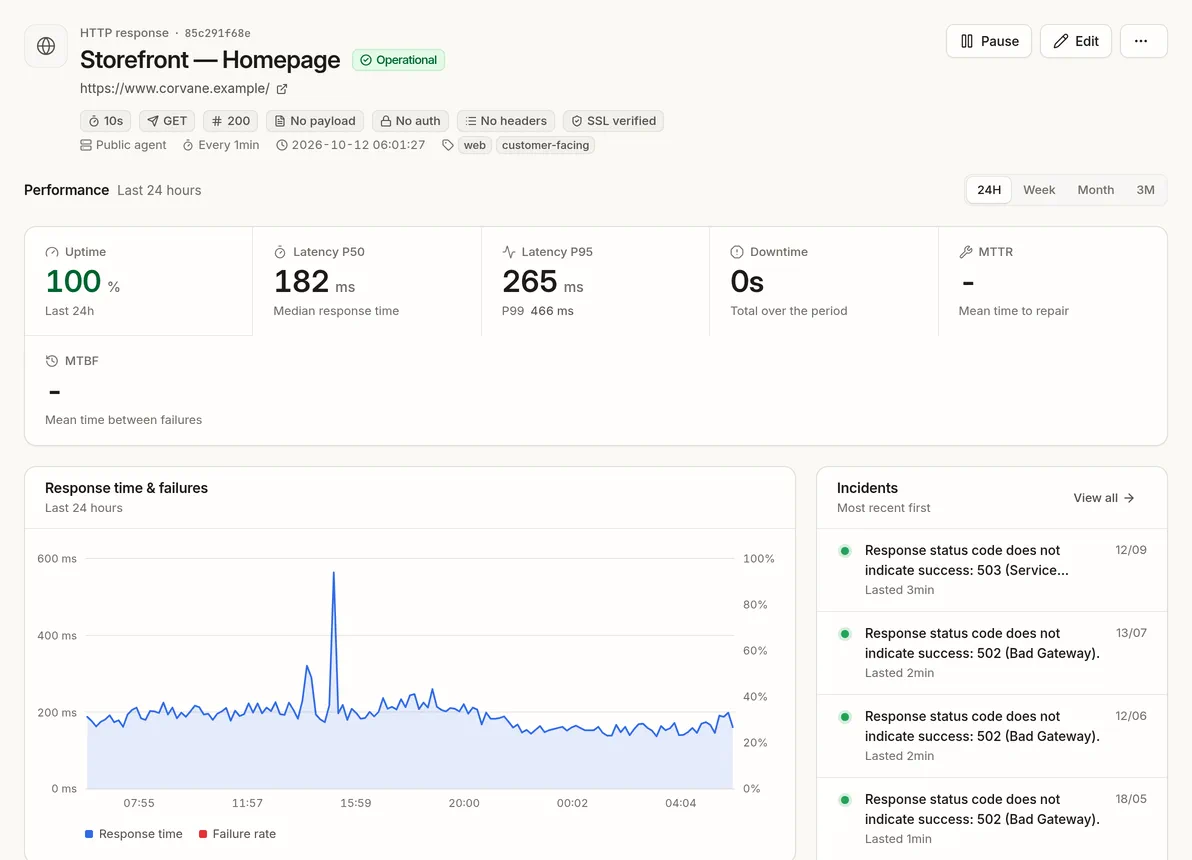
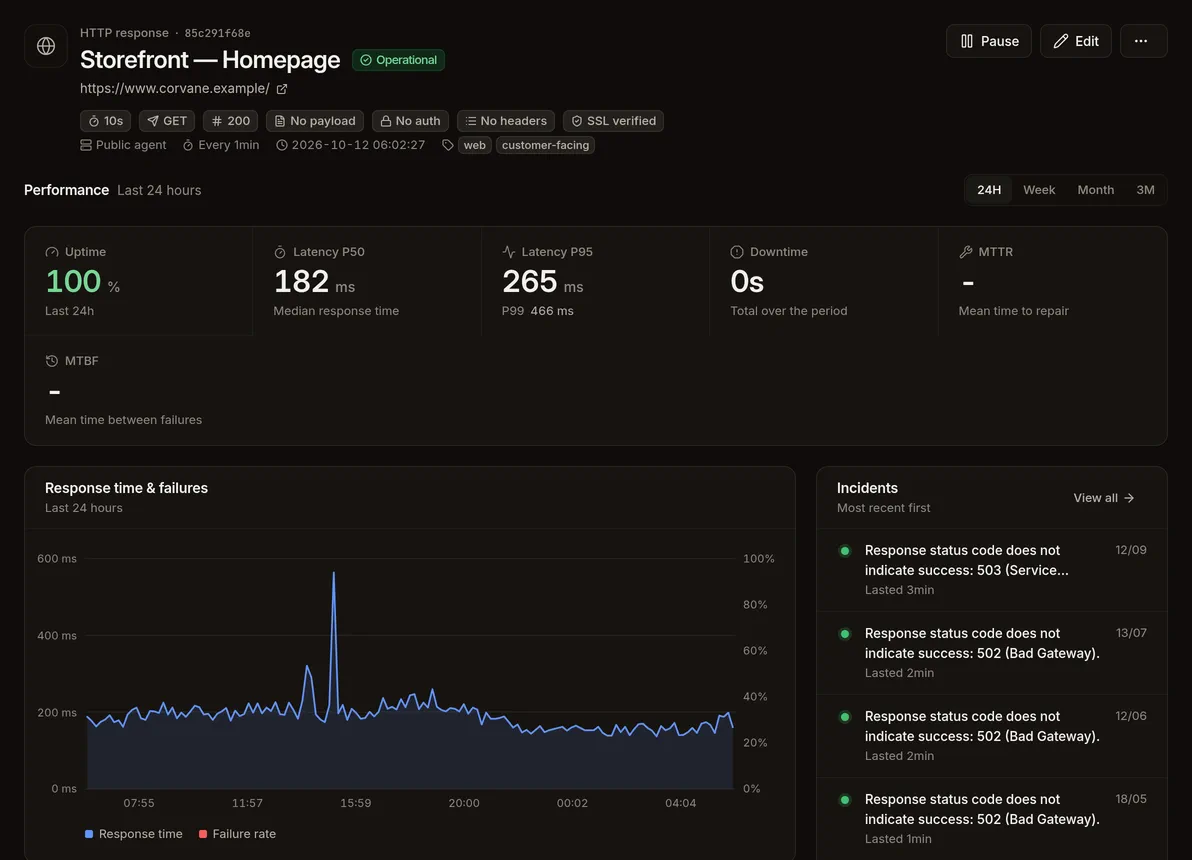
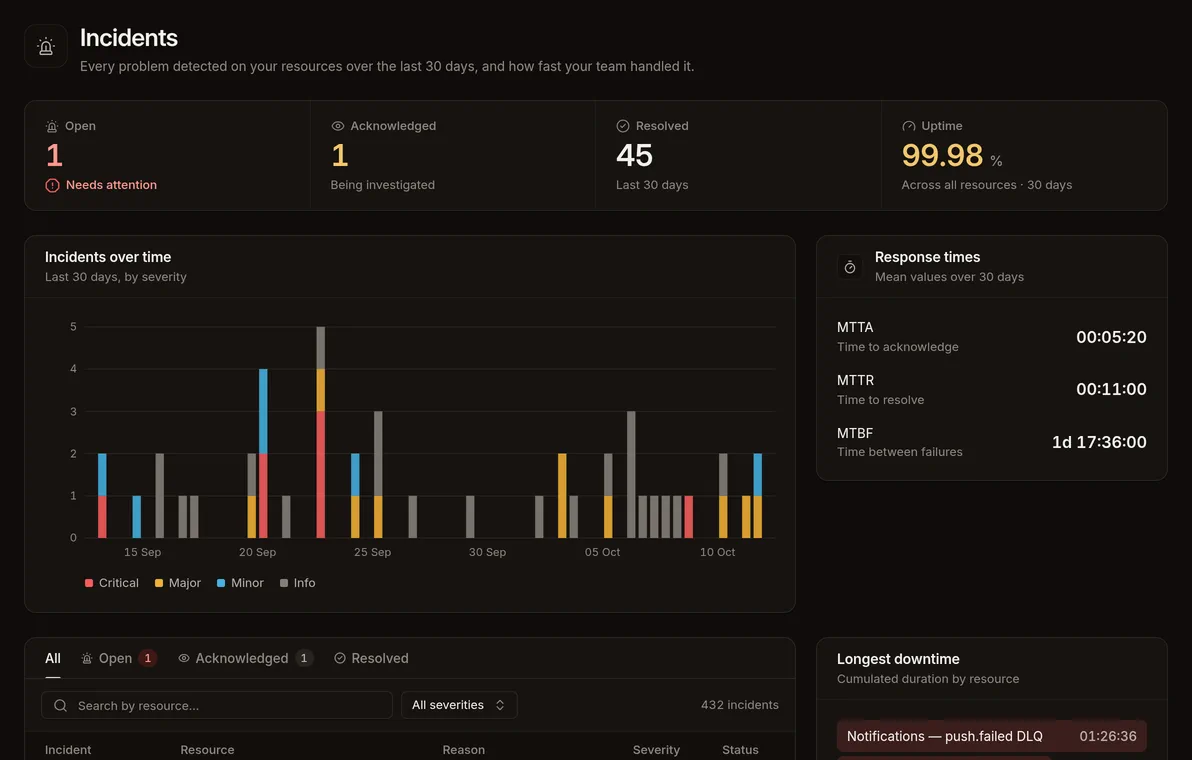
The real Onagre interface, with the data of a fictional company.
How Onagre works
From the first failed check to the post-mortem.
Onagre follows a problem from start to finish: it notices, explains, shows the impact, warns the right people and keeps the history.
01Detect
Know the moment something breaks.
Each sensor checks one thing your users rely on — a page, an API answer, a SQL query, a queue, a certificate — on the schedule you choose. Response times are recorded on every check, so a slowdown shows before an outage does.
Status codes, page content, JSON and XML values, query results
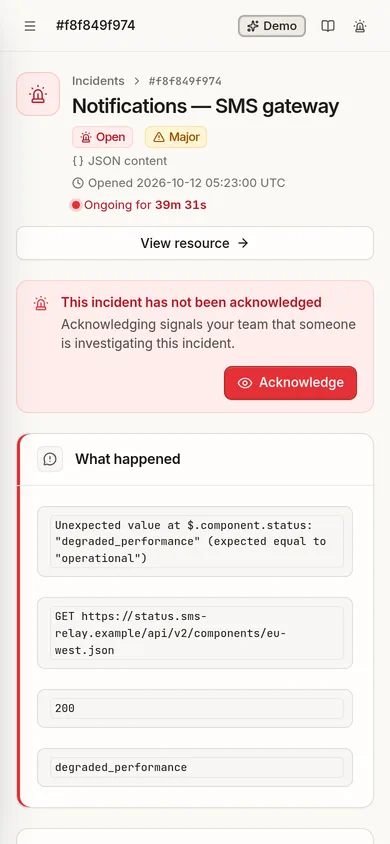
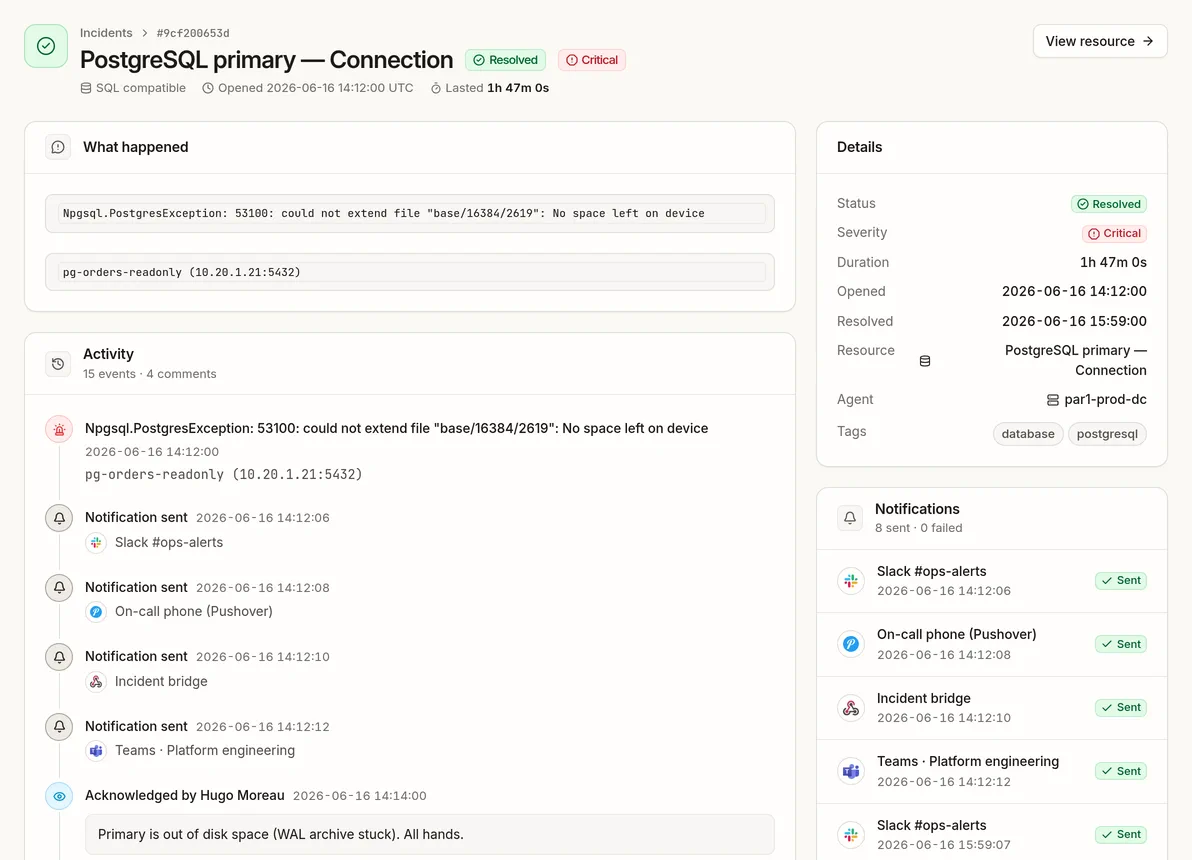
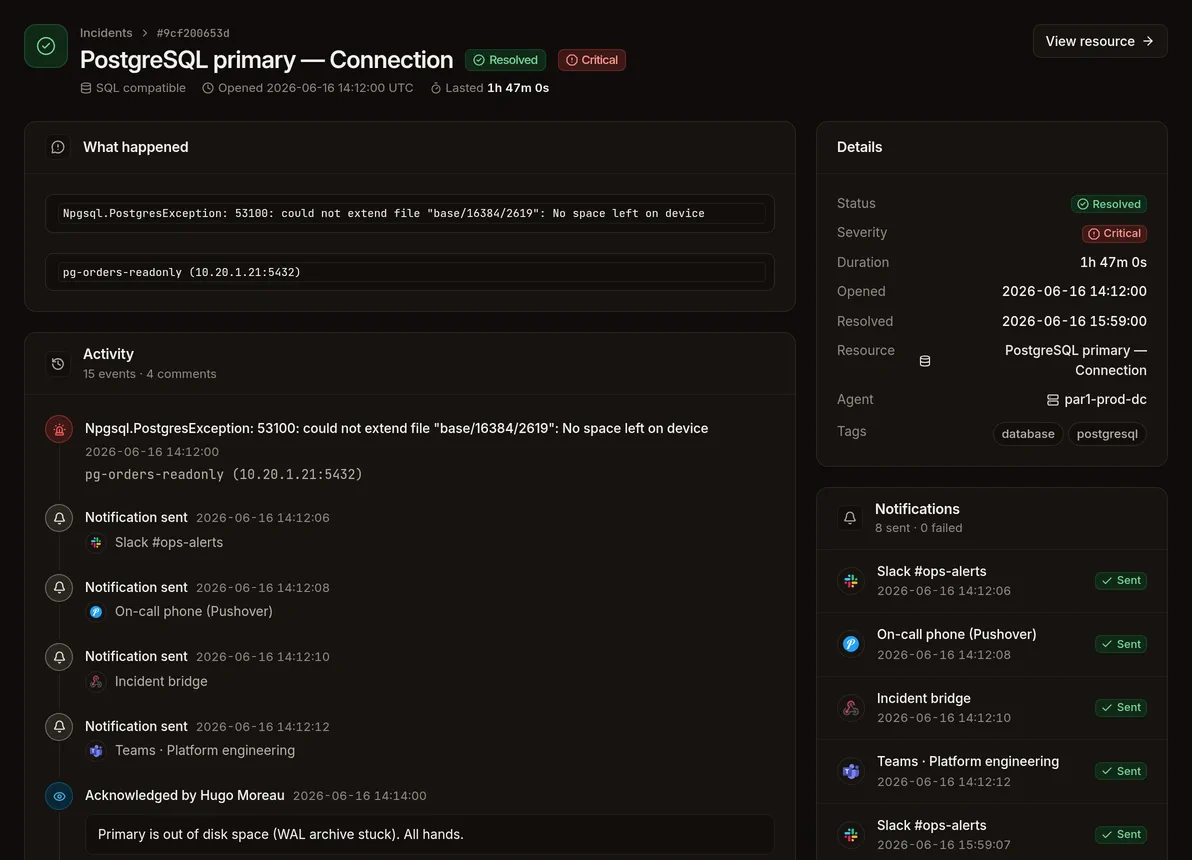
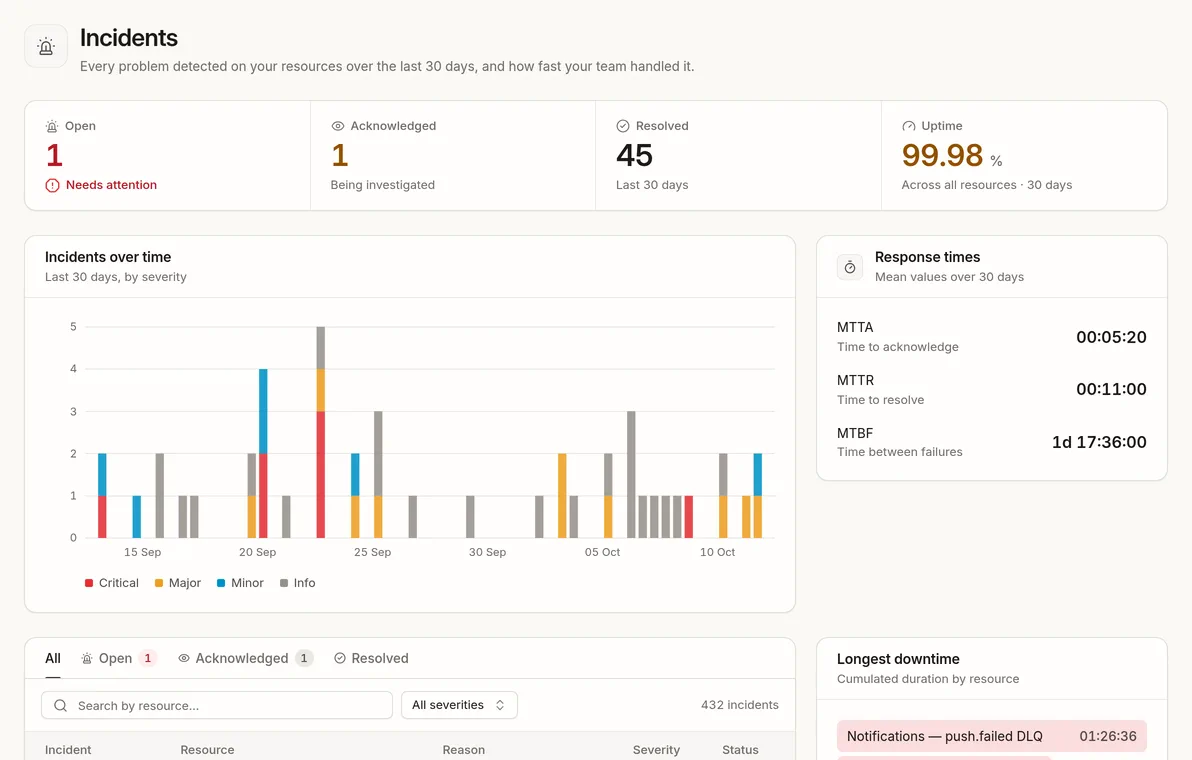
A failed check opens an incident with its severity, the error returned and a timeline: notifications sent, acknowledgement, comments, resolution. Everyone reads the same story, during the incident and after.
Severities from Info to Critical
Acknowledge and comment as a team
Time to acknowledge, time to repair and time between failures
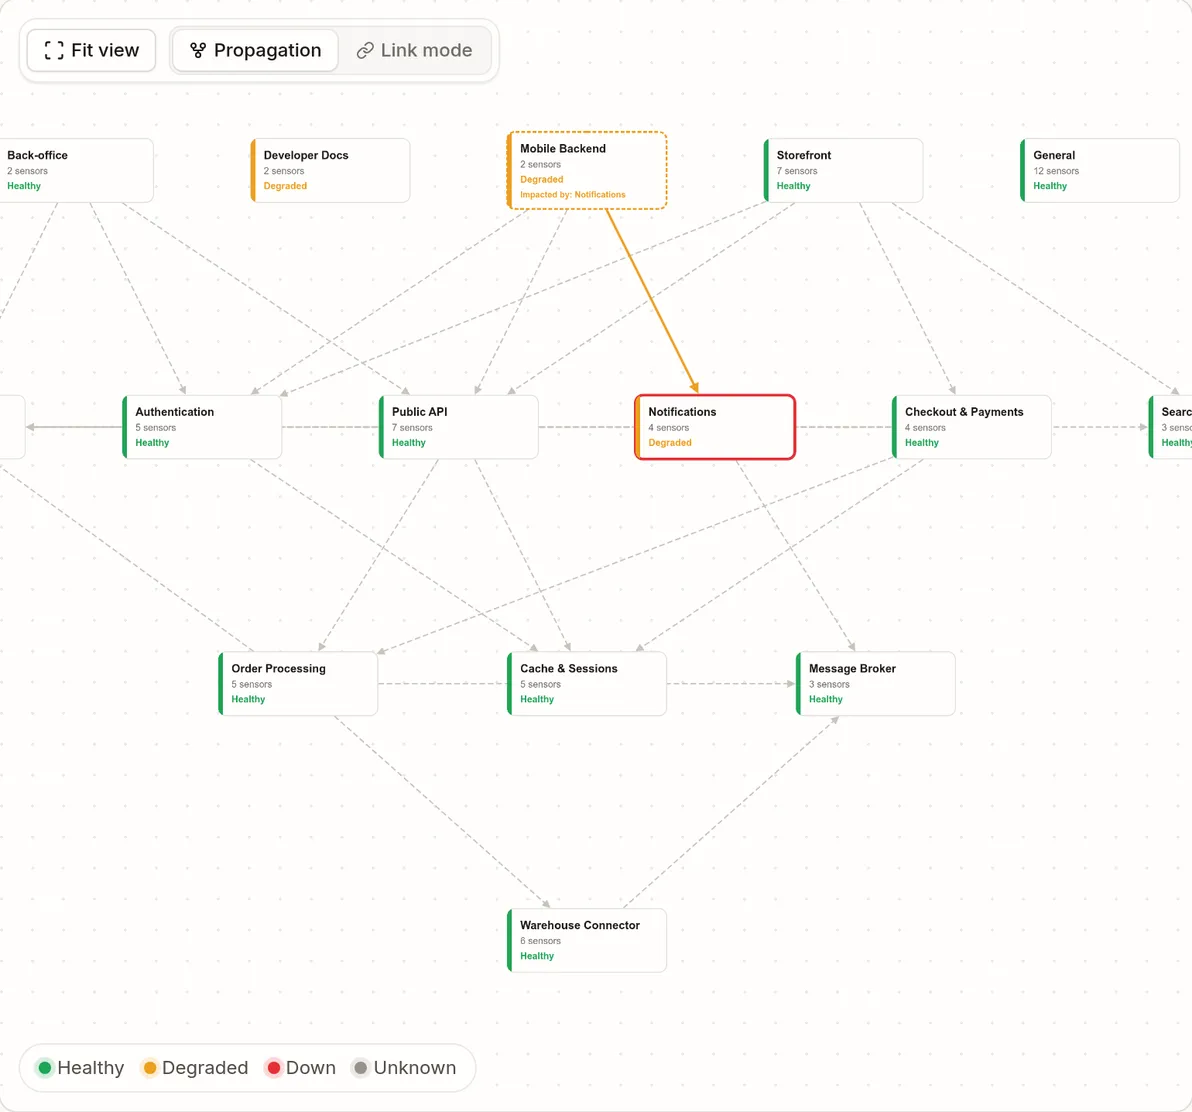
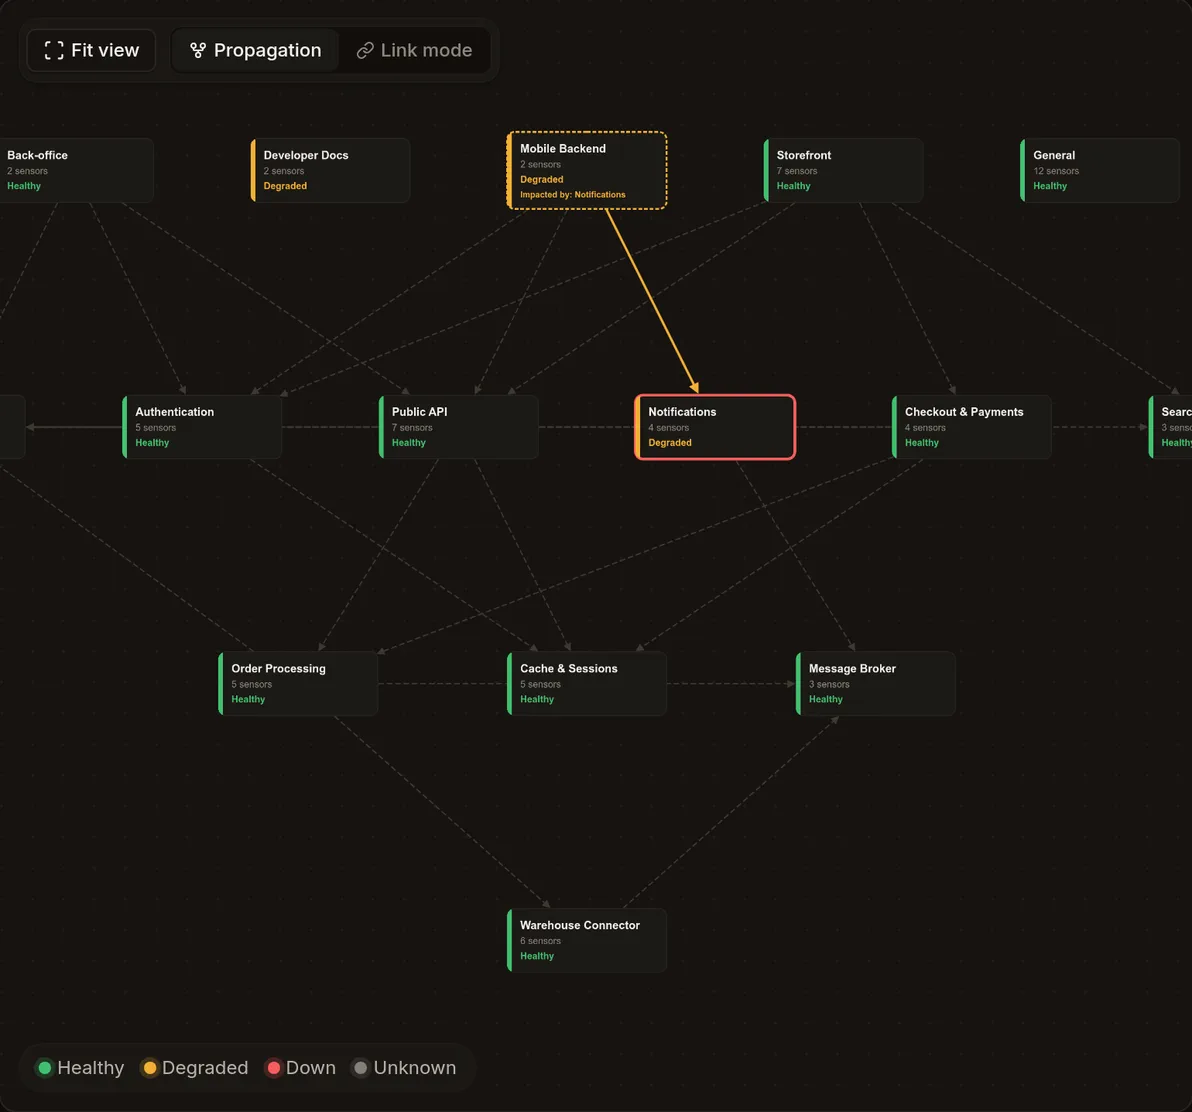
Group sensors into services and declare how they depend on each other. When a service degrades, the service map follows the dependencies and shows which services relying on it are impacted.
Notifications reports a failing SMS gateway: its border turns amber.
Impact is propagated
Mobile Backend depends on it. With propagation on, it is marked as impacted.
The rest stays readable
Healthy services stay green, so the team knows where not to look.
04React
Alert the right people, where they already are.
Attach integrations to each sensor's alert rule: a team channel for one, a phone for another. Schedule maintenance windows so planned work does not page anyone.
Nine channels, including webhooks for your own tools
Maintenance windows pause checks for the whole organization or for chosen agents
Uptime, downtime, latency percentiles and incidents by sensor, from the last 24 hours to the last three months. Spot what keeps failing and show what has improved.
Incident volume by severity over time
The resources that fail most, ranked
Use cases
Monitor what your business runs on.
Start from what you want to protect. Onagre picks the right checks.
Check from the internet. Or from inside your network.
Public agents run on Onagre's infrastructure and check what is exposed to the internet, with nothing to install. For everything else, a lightweight private agent runs in your network and keeps one outbound connection to the Hub.
The internet
Your websiteHTTP · keyword
Public APIJSON · response time
TLS certificate42 days remaining
Onagre
Public agenthosted by Onagre
gRPC
Hubschedules · incidents · alerts
Your private network
Private agentLinux · Windows · Docker
outbound · TLS
PostgreSQLSQL query
RabbitMQdead-letter queue
IntranetHTTP · port
Public agentsIncluded in every plan. Nothing to install, nothing to open.
Private agentsOne outbound connection to the Hub. No inbound port, no VPN.
The Hub decidesAgents run the checks the Hub sends and return raw results. Configuration stays in Onagre.
No, not for anything reachable from the internet. Create an account and Onagre's public agents check your websites, APIs, DNS, ports and certificates. You install an agent only to monitor resources inside a private network.
What can Onagre monitor?
Websites and APIs (status, content, JSON and XML values), hosts and ports, DNS resolution, TLS certificates, SQL databases (PostgreSQL, MySQL, MariaDB, SQL Server, Oracle), Redis, RabbitMQ dead-letter queues, file checksums, scheduled jobs through heartbeats, and the servers running an agent.
How do private agents connect?
A private agent opens a single outbound connection to the Onagre Hub over TLS and keeps it open. No inbound port and no VPN are needed. It runs on Linux (x64, ARM64), Windows (x64, x86) and Docker.
Which notification channels are supported?
Email to team members, Slack, Discord, Microsoft Teams, Google Chat, webhooks, Pushover, Gotify and the Onagre Android app. Email, Slack and Discord are available on every plan; Teams, Google Chat, webhooks, Pushover and Gotify with paid plans.
Where is Onagre hosted?
In France, on Scaleway infrastructure in Paris.
Is there a free plan?
Yes. The Free plan includes 10 sensors with no time limit and no credit card: HTTP, keyword, JSON and XML checks every 5 minutes, alerts by email, Slack and Discord.
Start watching what your business runs on.
Free for up to 10 sensors, without a credit card. Public checks need nothing to install.